909
Views & Citations10
Likes & Shares
Electrical Capacitance Tomography (ECT) is an imaging process based on
capacitance change technique. The fundamental concept of ECT is to image a
given structure by using image reconstruction based on the capacitance values
measured which gives the permittivity distribution of the material to be
imaged. The capacitance values are obtained from an ECT sensor which further
forms the data set for signal conditioning unit. Signal conditioning unit
converts the output of ECT sensor to a form which can be given for image
reconstruction. Since ECT is an inverse problem, an image reconstruction
technique has to be used to find the solution accordingly. In this paper, we
focus on design and fabrication of an ECT sensor for bone imaging and a signal
conditioning unit for the same. This paper deals with software and hardware
sections of the same. In software section, a 12 electrode ECT sensor is modeled
which is implemented on various media viz. air, water and bone using ANSYS. A
capacitance to voltage converter is designed using MULTISIM for the sensor
model. In hardware section, ECT sensor is fabricated using the specifications
of the sensor model. An overview of image reconstruction algorithms that can be
used are discussed and presented.
Keywords: Electrical
capacitance tomography sensor, Signal conditioning circuit, Image
reconstruction, Fabrication
INTRODUCTION
Electrical
Capacitance Tomography (ECT) is used for imaging and visualizing and thereby
obtaining information of the contents within a closed structure. It therefore
has wide applications in monitoring industrial processes like multi-phase flow,
conductive flow and measuring various distributions like permittivity,
conductivity in oil pipelines and solids/gas mixtures in fluidised beds and
pneumatic conveying systems. When the mixture is flowing along the vessel,
measurements of the concentration distributions at two axial planes allow the
velocity profile and the overall flow rate to be found in some cases. Some
applications are: (1) With ECT sensor of voltage excitation and current
measurement strategy is used for both ECT and ERT measurement by which
conductivity and permittivity distributions can be reconstructed [7]; (2)
non-radioactive gas/oil/water flow apparatus on flow conditioning device and
multi-modality ECT and microwave sensors [9].
The current imaging
techniques in biomedical field are X-ray, X-CT, Cone Beam CT and
Ultrasonography. X-ray is a 2D imaging technique and uses radiation while X-CT
is a 3D imaging technique and uses radiation. CBCT uses radiation and lacks
appropriate bone density determination as well while Ultrasonography is safer
as it uses sound waves but has the disadvantage of not being able to penetrate bone
and completely aborted by air. ECT can similarly be used for medical imaging
without use of radiation and being non-intrusive and non-invasive over the
conventional imaging techniques and therefore its scope in this field is being
looked upon. ECT has wide applications in root canal therapy (RCT) and revision
total hip replacement (THR). RCT is a painful dental procedure while THR is a
lengthy operation and has high risk. Therefore these 2 medical procedures
demand a reliable method for visualised surgery and to navigate surgical tools.
Real time imaging and accurate positioning of a surgical tool is demanded to
reduce the risk of damage to the remaining tissues, thereby conducting an
efficient operation for which the conventional imaging techniques cannot be
used as they are radioactive.
Therefore ECT can be
used to visualise tooth surfaces and anatomy of thigh and position surgical
tool. Also ECT has a fast imaging speed making it possible for real time
imaging. Accuracy of ECT can be improved by fusing images obtained by it with
the images from X-ray and X-CT. Also ECT can be used for observing internal
body structures for a physician's training [6].
ECT sensor was
modelled and calibrated using ANSYS [2] and the modelled sensor was fabricated [1].
Stress intensity factor, K and strain energy release rate, G have been obtained
by using three point bending test in two-dimensional (2D) model of cortical
bone in human thigh segment [4]. Signal conditioning circuits like which uses a
current sensor that detects the current and converts it into an easily
measurable output voltage [3] and charge-discharge circuit [8] have been
implemented. Image reconstruction algorithms that can be used For Electrical
Capacitance Tomography like Linear Back Projection [5], Linear Back projection
with iteration, Landwebers transform and Tikhonov transform [12] and Iterative
Multivariate Linear Regression [13] are discussed.
RESEARCH METHODOLOGY
Software
implementation of ECT is done by modelling an ECT sensor using ANSYS followed
by a capacitance to voltage converter using MULTISIM and finally image
reconstruction using the data using MATLAB with an appropriate algorithm.
Hardware implementation is done by fabricating the ECT sensor using dimensions
of the model, designing a corresponding current to voltage converter and
finally image reconstructing it to obtain an image of the internal structure of
the hollow portion of sensor.
Block diagram
The ECT system
comprises of the following sections and hence forms the block diagram as shown
in Figure 1. The input to the ECT
system is the object placed within the sensor that is to be imaged. The ECT
sensor is excited by giving an AC signal. The ECT sensor then measures the
capacitance proportional to the permittivity of the medium in the hollow space
of the ECT sensor. The ECT sensor gives a set of capacitance values for an
object for every pair of excitation of its electrodes. This set of data is
further given to a signal converter circuit. The signal converter circuit
converts the capacitances in pF to voltage values in mV. This conversion is
done in order for the data to be appropriate to be given for image
reconstruction. The data in mV is given to a computer which has the image
reconstruction algorithm that can read and process this data. An appropriate
image reconstruction algorithm for obtaining a permittivity distribution image
of hollow portion of sensor based on the capacitance measurements need to be
analysed and used. The output of the ECT system is an image showing the object
within the sensor.
ECT sensor
ECT sensor has to be customised for every application.
The basic construction of ECT is to mount conducting metal electrodes over a
non-conducting structure. The hollow portion within the structure is the space
where the object to be imaged is placed. The entire hollow portion is imaged
along with the structure placed in it. For a biomedical application, the sensor
has to be non-invasive for which the electrodes have to be mounted outside the
tube over an industrial application where the electrodes can be mounted inside,
outside or embedded in the wall of the tube. As good angular resolution is
required, a larger number of longer measurement electrodes will be needed, but
at the cost of reduction of axial resolution and maximum frame capture rate.
Biomedical sensor thus requires higher number of electrodes due to high
resolution requirement in imaging many permittivity variations of tissues and
bones and minute details of internal body structures as compared to industrial
application where imaging speed is more important due to the need to image and
monitor fast flowing fluids. Thus, 12 electrodes are used over 8 in industries.
Also a biomedical sensor requires ease with which a human body can be placed
due to which a circular cross section is preferred over other shapes. Thus, an
ECT sensor for biomedical application looks like in Figure 2.
This ECT sensor is
modelled using ANSYS. The conductive electrodes are taken as copper while the
material for nonconductive material is taken as PVC. The ECT sensor is modelled
in the electric mode. Properties of the materials used and the dimensions of sensor
are defined for its geometric modelling. By setting element attribute pointers,
the element attributes to the solid model entities are allocated. A mesh
control is chosen and the entire structure is meshed. Meshing is used for
getting finite elements which defines the accuracy of the solution obtained.
Simultaneous set of equations are solved that the finite element method
generates for the model. Loads are applied as electric boundary voltage on
areas. The source electrode is supplied 20 V and subsequent electrodes are
detector electrodes and are given 0 V one after another and results are plotted
in post processing. Post processors help to find out whether the design really
works when put to use. Voltage distribution is thus plotted and observed for various
media. The image of every step in modelling a sensor is shown step by step in Figure 3.
The voltage
distribution within the sensor is plotted for air and water. A bone with
surrounding medium as air is modelled within a sensor. The voltage distribution
within the sensor with bone is plotted.
3D model of the
sensor with bone within it surrounded by air is modelled and shown in Figure 4.
Front view of the 3D
sensor modelled is shown in Figure 4
which is similar to the images shown in Figure
5.
Hardware section
A 12 electrode ECT
sensor is fabricated and a femur bone was sculpted according to the 3D model
shown in Figure 6. Based on the
dimensions used in the 3D model, PVC tube is used and Copper electrodes are cut
out from a thin Copper sheet and fixed on the PVC tube with equal spacing using
Araldite as shown in Figure 6. The
sculpted is bone and eventually placed in the sensor as shown in Figure 6, to take readings of the
sensor with bone in it.
Source of 20 V, 20
kHz square wave signal with 50% duty cycle is given by function generator to
the source electrode. The current flow is measured using a multimeter by
connecting it to the detector electrode. The negative terminals of function
generator and multimeter are connected together thereby completing the circuit.
The setup is show in Figure 7.
Signal converter
Capacitance values
from sensor have to be converted to voltage values in order to be given for
image reconstruction. The converter circuit is connected to a PC and the result
is displayed using MATLAB. The signal converter circuit is implemented using
MULTISIM. MULTISIM is a powerful schematic capture and simulate software using
which electronic circuits and SPICE can be simulated and Printed Circuit Boards
can be prototyped. The signal converter used here is a capacitance to voltage
converter as shown in Figure 8.
The op-amp used in the circuit is a simplified 3-terminal op-amp. Cf and Rf are the feedback components. Signal generator gives a 20 V, 20 kHz source signal. In the circuit, the square wave excitation signal is generated by the signal generator which is set to 20 V amplitude and 20 kHz frequency. The excitation signal is applied to the source electrode while the detector electrode is given to negative of op-amp for that particular pair of electrodes across which the measurement is taken. The charging voltage is detected by the op amp with capacitive and resistive feedback circuits. The AC signal from the measured capacitance from ANSYS is further given for conditioning which is defined in the circuit as the known capacitance C2. The current flowing out of C2 is given to the I to V converter which consists of op-amp Cf, Rf which converts it into AC voltage which is measured using multimeter. The negative terminals of signal generator and multimeter are grounded and the positive terminal of the op-amp is grounded with these too. AC voltage output of the capacitance to voltage converter is directly proportional to the measured capacitance. Rf and Cf are varied to get the voltages within a particular range. The output of the capacitance to voltage is given by Equation (1).
V0=-jwC1Rf/ jwC1Rf+1 *Vi (1)
The circuit possesses
features which make it suitable for biomedical application. It has the
following advantages: (1) reduces drift problem, (2) provides high SNR, (3)
provides good linearity and (4) immune to stray capacitances introduced by the
coaxial cables and disadvantage that it can be used only for low range
excitation source and will be affected by high frequency range. As the
excitation voltage used is low range in order to be non-invasive for biomedical
application, this signal conditioning unit is apt to be used here.
Image reconstruction
The voltage values
obtained from signal conditioning unit is converted to pixel values for forming
an image according to an algorithm best suited for the application. The limited
voltage values which are 66 in number have to be projected onto a 32 × 32 square
pixel grid within which the sensor cross section is defined. For a circular ECT
sensor, the cross section is a circle with 812 pixels out of the total 1024
pixels. ECT is an inverse problem as the inter-electrode capacitances are
measured while the permittivity distribution within the sensor is to be known
which the inverse of the actual measurement is. The equation of the forward or
actual measurement is represented in Equation (2).
C = S.K (2)
Image reconstruction
algorithm is chosen based on the ease to generate it, image resolution and
speed required. The principle of Linear Back Projection algorithm (LBP) is that
once the set of inter-electrode capacitances C have been measured, the
permittivity distribution K can be obtained from these measurements using an
inverse transform Q as follows:
K = Q.C (3)
Q is the inverse of the matrix S. However, the LBP algorithm uses the
transpose of the sensitivity matrix due to non-existence of inverse of S as S is
not a square matrix. LBP is a simple algorithm which produces approximate, but
very blurred permittivity images. The LBP algorithm acts as a spatial filter
with a lower cut-off frequency than that of the fundamental filter. To improve
the accuracy of the LBP images, LBP is implemented using an iterative method.
In the iterative method, after implementing LBP the permittivity values of K
are used to back calculate inter-electrode capacitances to form a new set C2.
C2 = S. K1 (4)
A set of error
capacitances ΔC is then calculated which is further used to calculate error
pixel values ΔK which is used to generate new set of pixel values K2
by subtraction. Iteration is repeated by putting K2 in (2) to
calculate new set of capacitances C3. Set of error capacitances ΔC
is then calculated by subtraction of original measured capacitances from C3
to further calculate ΔK and K3. This iteration can be repeated as
many times as desired until a satisfactorily accurate image is produced.
Tikhonov Transform and Landweber Transform are algorithms to generate enhanced
images without iteration. Tikhonov Transform uses equation (5) over equation
(3) used in LBP to calculate permittivity distribution K.
K = ST..C/ST.S (5)
However, Tikhonov transform introduces a Tikhonov constant t along with
an identity matrix I in the denominator in order to prevent the danger of
division by zero if S is small. Thus equation (5) becomes,
K = ST..C/ST.S +t.I (6)
The constant t has to
be chosen such that the image produced is less noisy and has higher definition.
Landweber transform uses a transformation matrix QL defined as,
QL = V.F (W,t,N).U’ (7)
Where V, W and U are
matrices obtained from sensitivity matrix S after the process Single Value
Decomposition (SVD) is applied to it. F is the SVD filter function matrix, t is
the Landweber transform L and N is the number of iterations. L should be chosen
such that it does not give rise to spurious artefacts around the edges of the
image and it gives an image with better resolution.
RESULTS AND DISCUSSION
Voltage distribution
within sensor model for various media are plotted and observed (Figure 9).
The capacitance
values obtained from ECT sensor model are plotted for electrode 1. The
capacitance values are obtained for various media viz. air, water and bone. The
plots for various media are compared (Figure
10).
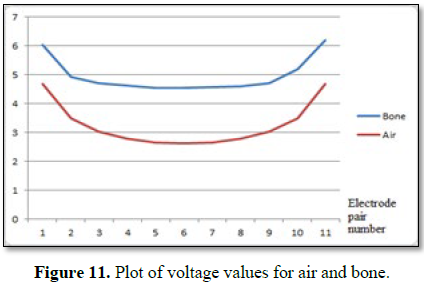
The output of signal converter for air and bone are plotted. The
voltage values obtained from the signal converter for different media are
compared and also compared with the capacitance values obtained from sensor (Figure 11).
CONCLUSION
ECT sensor and signal
converter form important parts of ECT system. It is therefore, essential to
calibrate the modelled ECT sensor and implement it for bone in order to design
a biomedical application based ECT system and to design a signal converter for
the sensor model and implement and analyse it for different media. The voltage
distribution plots of sensor model show that the voltage penetrates easily and
is uniformly distributed for air with permittivity 1 while for water with
permittivity 80, the voltage penetration is restricted and the distribution is
non-uniform. Therefore, voltage distribution is smooth for low permittivity
medium, while it is not smooth for high permittivity medium. When bone is
placed within the sensor with surrounding medium as air, the distribution is
smooth in air but when it encounters bone the distribution is hindered and due
to permittivity variation thus non uniformity in the distribution is observed
thereby indicting the effectiveness of the sensor for bone imaging. Similarly,
the plots of capacitance values from the sensor model, the curve for air are
the lowest, the curve for bone is in the middle and the curve for water is the
highest. Air has the least permittivity; bone has second lowest permittivity
and water has the highest permittivity. Therefore, we conclude that the curves
are in order of their permittivity indicating that the measured capacitances
are proportional to the permittivity of the medium to be imaged. The plot of
current values from the fabricated sensor shows that the curve for air is lower
and smoother than that of bone similar to that of the capacitance plot while
the difference between the 2 curves is small for the former plot as compared to
the latter plot due to the unit of the quantities measured being different.
Thus, the hardware output values plot for air and bone follow the curve as the
sensor model output values plot thereby indicating that the fabricated sensor
performs like the modelled sensor, approving its use for medical imaging. The
signal converter circuit should convert the capacitance values to proportional
voltage values which can be seen from the voltage values plot for air and bone
thereby indicating the data obtained from the signal converter to be reliable
to be given for further processing viz. image reconstruction.
1.
Ambika M, Selvakumar S (2018) Modelling, calibration
and fabrication of electrical capacitance tomography sensor for bone imaging.
Presented at the 3rd International Conference on Advances in
Materials & Manufacturing Applications, Bangalore, India.
2.
Ambika M, Selvakumar S (2018) Modeling and calibration
of electrical capacitance tomography sensor for medical imaging. Biomed
Pharmacol J 1: 1471-1477.
3.
Manikandan K, Sathiyamoorthy S (2016) Modelling and
implementation of AC electrical capacitance tomography. Circuits and Systems 7:
3818-3830.
4.
Hassan MKA, Zarzour FM, Salim MS (2016) Finite element
analysis of cortical bone fracture in human thigh segment. Journal of
Telecommunication, Electronic and Computer Engineering 10: 135-138.
5.
Manikandan K, Sathiyamoorthy S (2015) Reconstruction
of image in electrical capacitance tomography. Int J Appl Eng Res 10:
30713-30724.
6.
Ren Z (2015) Exploration of medical applications of
electrical capacitance tomography. Ph.D. Thesis, University of Manchester.
7.
Sun J, Yang W (2015) A dual-modality electrical
tomography sensor for measurement of gas-oil-water stratified flows.
Measurement 66: 150-160.
8.
Kryszyn J, Smolik WT, Radzik B, Olszewski T, Szabatin
R (2014) Switchless charge-discharge circuit for electrical capacitance
tomography. Measurement Science and Technology 25.
9.
Li Y, Yang W, Wu Z, Tsamakis D (2013) Gas/oil/water
flow measurement by electrical capacitance tomography. Measurement Science and Technology.
10.
Abraham BB, Anitha G (2012) Designing of lab view
based electrical capacitance tomography system for the imaging of bones using
NI ELVIS and NI USB DAQ 6009. Bonfring International Journal of Power Systems
and Integrated Circuits 2: 2277-5072.
11.
Zimam MA, Mohamad EJ, Rahim RA, Ling LP (2012) Sensor
modeling for an electrical capacitance tomography system using comsol
multiphysics. Jurnal Teknologi 55: 33-47.
12.
Process Tomography Ltd. (2009) Electrical capacitance
tomography system type TFLR 5000. Available at: http://www.tomography.com
13.
Yan H, Liu LJ, Qiang DZ (2009) An iterative electrical
capacitance image reconstruction algorithm. International Symposium on
Computational Intelligence and Design.


QUICK LINKS
- SUBMIT MANUSCRIPT
- RECOMMEND THE JOURNAL
-
SUBSCRIBE FOR ALERTS
RELATED JOURNALS
- Journal of Blood Transfusions and Diseases (ISSN:2641-4023)
- International Journal of Diabetes (ISSN: 2644-3031)
- Advance Research on Alzheimers and Parkinsons Disease
- Journal of Pathology and Toxicology Research
- Journal of Psychiatry and Psychology Research (ISSN:2640-6136)
- Archive of Obstetrics Gynecology and Reproductive Medicine (ISSN:2640-2297)
- Journal of Carcinogenesis and Mutagenesis Research (ISSN: 2643-0541)